Shack-Hartmann
wavefront sensor is a brainchild of Cold War, born in late 1960-s by the need of US Air Force "to improve the images of satellites taken from earth" -guess who's satellites caused such intense interest of Uncle Sam.
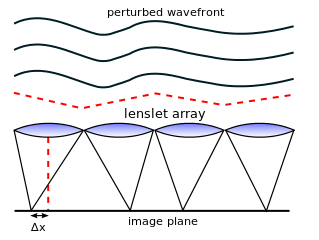
The working principle is simple and elegant - the wavefront sampled by an array of micro-lenses, and its local slope is converted into displacements of focal spots:
 To make an SH sensor today, one needs an array of microlenses and a digital camera. The main difficulty is accurate calibration and the software which will convert camera images into wavefront reading.
Thorlabs sells reasonably priced SH sensors and I purchased the WFS-150-7AR for my project.
 It is well built, comes with plate adapter and a C-mount ring adapter. The software runs smoothly and produces expected results (flat wavefront) when tested on spatially filtered and collimated HeNe laser.
The manual is very detailed, and API comes in C, C#, and LabView libraries, with basic examples. Very pleasing experience, especially after recently purchased deformable mirror from Imagine Optic which came barely naked in terms of API.
The sensor comes calibrated and tested, but one can do own calibration if desired. The software allows full control of the sensor, which is critical for research applications.
The wavefront can be measured directly and/or fitted with Zernike polynomials up to user-specified order.
The bad
Upon a closer look into LabView code that came with the SH sensor, things got worse. The front panel of main example VI is somewhat messed and hard to read, and when you press Measure the program pops notification windows with huge speed, which you fruitlessly struggle to close for a minute before killing LabView via Task Manager. This is a bad management of exceptions, when non-critical messages pop-up in separate windows and paralyze the user interface.
The wiring diagram is even more messy. If you write in LabView, you will know what I mean.

I am still figuring out how to extract meaningful status messages from the API in a non-paralyzing manner, there seems to be a bug which makes error codes nonsensical. I contacted Thorlabs with questions, and will follow up.
I will post my LabView control VI for this wavefront sensor when ready.
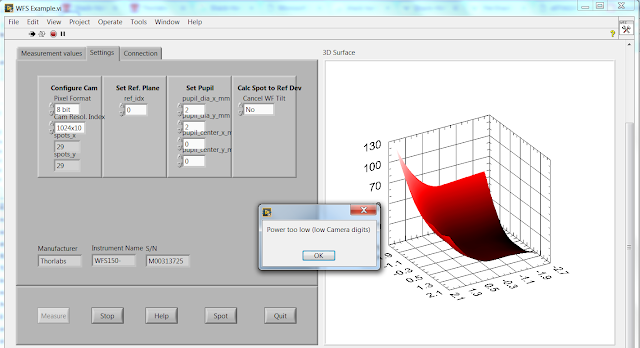
Update: Thorlabs replied promptly and explained the error codes. The device status is returned as a single integer number, and it's individual bits contain several status codes. For example, when device returns integer 1796, it is 0x00000704 in hex representation, which is a sum of 4 different messages:
0x00000004 WFS_STATBIT_PTL Power Too Low (low cam digits)
+ 0x00000100 WFS_STATBIT_CFG Camera is ConFiGured
+ 0x00000200 WFS_STATBIT_PUD PUpil is Defined
+ 0x00000400 WFS_STATBIT_SPC No. of Spots or Pupil Changed
______________________________________
= 0x00000704
This is a very non-orthodox approach to status codes! 8-)
Update 21.10.2017
I wrote a suite of LabView virtual instruments for controlling the sensor, available on my github.
If you have a sensor, install Thorlabs drivers, connect it via USB and run the WFS_Thorlabs_testPanel.vi
I tried to write clean and simple, with comments in the wiring diagram.
Tested on LabView 2016 32-bit.
IPython notebooks for controlling this sensor can be also found in my github.
LabView VI screenshots:

Update 18.03.2018
After some real-life testing, I found that it is hard to have a good signal/noise ratio on this sensor using fluorescent beads. The reason is relatively low photon flux passing through an individual lenslet. The incident light from a bead is divided by a total of 39x31 = 1209 lenslets. So, large beads (I use 4 micron diameter) and high laser power can become handy. The camera sensor is CCD, which allows to crank up the sensor gain (up to x5). Also, the exposure time can be set up to 65 ms, which is not terrifically high. I wish if could be 10x higher..
Lesson learned: if you want high resolution of a wavefront, you must sacrifice signal/noise ratio, or make your beads (or other guide stars) really bright!
wavefront sensor is a brainchild of Cold War, born in late 1960-s by the need of US Air Force "to improve the images of satellites taken from earth" -guess who's satellites caused such intense interest of Uncle Sam.
The working principle is simple and elegant - the wavefront sampled by an array of micro-lenses, and its local slope is converted into displacements of focal spots:
Thorlabs sells reasonably priced SH sensors and I purchased the WFS-150-7AR for my project.
The good

The manual is very detailed, and API comes in C, C#, and LabView libraries, with basic examples. Very pleasing experience, especially after recently purchased deformable mirror from Imagine Optic which came barely naked in terms of API.
The sensor comes calibrated and tested, but one can do own calibration if desired. The software allows full control of the sensor, which is critical for research applications.
The wavefront can be measured directly and/or fitted with Zernike polynomials up to user-specified order.
The bad
Upon a closer look into LabView code that came with the SH sensor, things got worse. The front panel of main example VI is somewhat messed and hard to read, and when you press Measure the program pops notification windows with huge speed, which you fruitlessly struggle to close for a minute before killing LabView via Task Manager. This is a bad management of exceptions, when non-critical messages pop-up in separate windows and paralyze the user interface.

The wiring diagram is even more messy. If you write in LabView, you will know what I mean.

I am still figuring out how to extract meaningful status messages from the API in a non-paralyzing manner, there seems to be a bug which makes error codes nonsensical. I contacted Thorlabs with questions, and will follow up.
I will post my LabView control VI for this wavefront sensor when ready.
Update: Thorlabs replied promptly and explained the error codes. The device status is returned as a single integer number, and it's individual bits contain several status codes. For example, when device returns integer 1796, it is 0x00000704 in hex representation, which is a sum of 4 different messages:
0x00000004 WFS_STATBIT_PTL Power Too Low (low cam digits)
+ 0x00000100 WFS_STATBIT_CFG Camera is ConFiGured
+ 0x00000200 WFS_STATBIT_PUD PUpil is Defined
+ 0x00000400 WFS_STATBIT_SPC No. of Spots or Pupil Changed
______________________________________
= 0x00000704
This is a very non-orthodox approach to status codes! 8-)
Update 21.10.2017
I wrote a suite of LabView virtual instruments for controlling the sensor, available on my github.
If you have a sensor, install Thorlabs drivers, connect it via USB and run the WFS_Thorlabs_testPanel.vi
I tried to write clean and simple, with comments in the wiring diagram.
Tested on LabView 2016 32-bit.
IPython notebooks for controlling this sensor can be also found in my github.
LabView VI screenshots:

Update 18.03.2018
After some real-life testing, I found that it is hard to have a good signal/noise ratio on this sensor using fluorescent beads. The reason is relatively low photon flux passing through an individual lenslet. The incident light from a bead is divided by a total of 39x31 = 1209 lenslets. So, large beads (I use 4 micron diameter) and high laser power can become handy. The camera sensor is CCD, which allows to crank up the sensor gain (up to x5). Also, the exposure time can be set up to 65 ms, which is not terrifically high. I wish if could be 10x higher..
Lesson learned: if you want high resolution of a wavefront, you must sacrifice signal/noise ratio, or make your beads (or other guide stars) really bright!
can you tell is there is any alternative sensor because i want for my project please tell me if you know any other wavefront sensor in low price. thank you
ReplyDeleteHello, thank you for sharing your work. I have a DIY wavefront sensor with a microlens array and a thorlabs camera. May I know if this can work with a camera instead of the commercial sensor?
ReplyDeleteThank you.
TC
0provaccorpi-Worcester Max Mullen https://wakelet.com/wake/6gzpQOuvHLLrZ1v9cD9ib
ReplyDeletefranovthrontha
WriaabXstir-ru Zach Kingery Install
ReplyDeleteAvast Cleanup
Your Uninstaller
menwhiwichpe
Mcremhaesubsto Dave Hundley Awesome
ReplyDeletegrowlaytouchsders